1 Introduction
- urban structure has a strong impact on urban-scale mobility patterns, indicating that different areas inside a city are associated with different inhabitants’ motion patterns
- there has not been sufficient research on characterizing and classifying mobility patterns in different urban areas from a dynamic perspective
- We analyze the hourly patterns (time series) of mobility aggregation in different urban areas and demonstrate their differences
- reference area와 각 polygon의 temporal mobility를 비교
2 Related Work
2.1 Mobility Modeling and Mobile Phone Data
- Larsen identified five types of mobility
- 1) Physical travel of people (e.g., work, leisure, family life) <- This research refers to "human mobility" as the first point.
- 2) Physical travel of objects (e.g., products to customers)
- 3) Imagination travel (e.g., memories, books, movies)
- 4) Visual travel (e.g., internet surfing on Google Earth)
- 5) Communication travel (e.g., person-to-person messages via telephones, letters, emails, etc.)
- individuals are atoms in an urban system, the spatiotemporal characteristics of an urban system could be viewed as a generalization of individual behavior
- Researchers have identified two major perspectives when exploring human mobility patterns from mobile phone data
- Individual perspective: This category of research mainly focuses on identifying individual trajectory patterns
- Urban perspective: Spatial division and morphology or Spatial clustering and spread
- most previous research has concentrated on exploring aggregated patterns when analyzing urban mobility from mobile phone datasets
- Here we focus on the temporal patterns of urban mobility
2.2 Dynamic Time Warping and Its Applications
- One important research question regarding time series data is finding whether two time series represent similar behavior
- Euclidean distance: not suitable for measuring the distance between time series data
- Discrete Fréchet Distance: very sensitive to outliers and displacements, therefore it is not very appropriate for time series data
- Dynamic Time Warping (DTW): has been well developed to measure the similarity between time series
3 Research Design
3.1 Dataset
- a city in northeast China
- 9 days of data including one million mobile phone users
- time, duration, approximate location of mobile phone connections, age, and gender
3.2 Methodology
- DTW measures the similarity of hourly mobility patterns between different urban areas -> allowing us to group similar patterns together
- DTW shows a much better performance of distinguishing different time series than Euclidean or Fréchet
3.2.1 Summarize Dynamic Population from Cell Phone Records
- 1) divided the study area into Voronoi polygons based on the spatial distribution of cell phone towers
- 2) summarized the hourly phone call frequencies for each polygon
- 3) calculated relative mobility patterns for each polygon

3.2.2 Calculate DTW Distance Matrix
- 1) constructed the DTW distance matrix for the relative time series associated with each of the selected Voronoi polygons
- 2) used a global constraint “Sakoe-Chiba band”, which has a fixed window width in both horizontal and vertical directions
- the window size is set to be 4, indicating that the maximum allowable absolute time deviation between two matched elements is 4 hours
3.2.3 Analyze Urban Mobility Patterns Based on DTW Distance Matrix
- conducted two example analyses for both circumstances based on the distance matrix
- 1) mobility similarity to reference areas
- 2) detecting outlier patterns
4 Data Analysis
4.1 Mapping the Similarity to Reference Areas
- Fig. 4 represents the similarity measure of mobility patterns between a reference polygon (marked red, where a major commercial street is located) and other urban areas
- The dark brown color indicates a more similar mobility pattern (shorter DTW distance)
- mobility patterns on weekdays are closer to the pattern in the reference area
- we will need additional socioeconomic data to conduct additional correlation analyses
- Fig. 5 shows the distribution of DTW distances between the benchmark series [1,1,1,1,1,1,1,1,1,1,1,1,1,1,1,1,1,1,1,1,1,1,1,1] and the study areas
- polygons with a smaller DTW distance have more evenly distributed mobility patterns
- There are more polygons on weekends in the first group (DTW distance < 0.2) indicating that the mobility patterns on weekends are closer to an evenly distributed pattern
4.2 Outlier Detection
- Our objective is to identify cell polygons with abnormal mobility patterns
- Since hierarchical classification can operate directly on the distance matrix, we adopt this method to classify the mobility time series
- we detected 15 outliers for weekdays and 18 for weekends
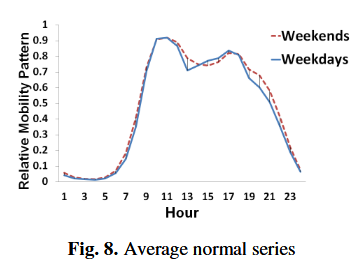
- Fig. 8 shows an average series for both weekdays and weekends after removing the outlier polygons
- two mobility peaks each day
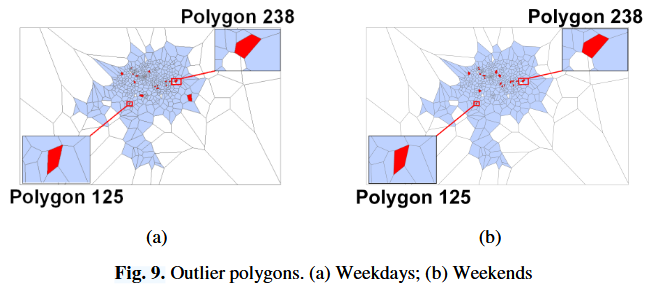
- Fig. 9 shows the results of the outlier detection
- there are slight differences between weekdays and weekends
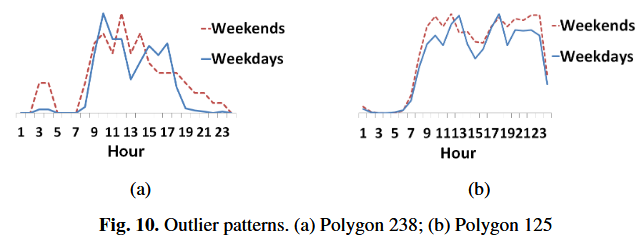
- Fig. 10 shows two examples of outlier time series
- In polygon 238 there are many night clubs and other leisure facilities for night hours
- In polygon 125 there are several community colleges and training schools
728x90
반응형


