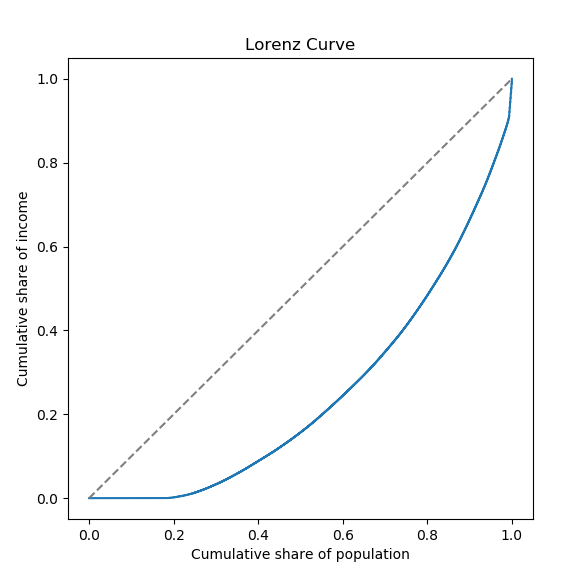
Lorenz Curve
이 코드는 입력으로 리스트, 넘파이 배열, 판다스 시리즈 등의 값들을 받아 Lorenz curve를 그린다. 먼저 입력값 x를 넘파이 배열로 변환하고, 이를 오름차순으로 정렬한다. 그런 다음 누적합(cumulative sum)을 계산하여 Lorenz curve를 그릴 수 있는 데이터 포인트를 만든다. 마지막으로 이 데이터 포인트를 이용하여 Lorenz curve를 그리는 matplotlib plot을 만든다. 반환값은 그래프다.
def lorenz_curve(x):
    """
    :param x: list, numpy array, or pandas series of values
    :return: matplotlib plot of Lorenz curve
    """
    # convert x to a numpy array
    x = np.asarray(x)

    # sort the array in ascending order
    x = np.sort(x)

    # calculate the cumulative share of total income
    cum_share = np.cumsum(x) / np.sum(x)

    # add (0, 0) to the plot
    lorenz_points = np.insert(cum_share, 0, 0)
    lorenz_points = np.vstack([lorenz_points, np.linspace(0, 1, len(lorenz_points))])

    # plot the Lorenz curve
    fig, ax = plt.subplots(figsize=(6, 6))
    ax.plot(lorenz_points[1], lorenz_points[0], drawstyle='steps-post')
    ax.plot([0, 1], [0, 1], color='gray', linestyle='--')
    ax.set_xlabel('Cumulative share of population')
    ax.set_ylabel('Cumulative share of income')
    ax.set_title('Lorenz Curve')
    plt.show()
결과물 예시
Gini Coefficient
이 코드는 입력으로 리스트, 넘파이 배열, 판다스 시리즈 등의 값들을 받아 Gini coefficient를 계산한다. 먼저 입력값 x를 넘파이 배열로 변환하고, 이를 오름차순으로 정렬한다. 그런 다음 누적합(cumulative sum)을 계산하여 Gini coefficient를 계산한다. 반환값은 Gini coefficient의 값이다.
def gini_coefficient(x):
"""
:param x: list, numpy array, or pandas series of values
:return: float, Gini coefficient
"""
# convert x to a numpy array
x = np.asarray(x)
# sort the array in ascending order
x = np.sort(x)
# calculate the cumulative sum of elements from the beginning and end of the array
cumsum = np.cumsum(x)
cumsum_reverse = np.cumsum(x[::-1])
# calculate the Gini coefficient
gini_coef = 1 - 2 * (np.sum(cumsum_reverse) / cumsum_reverse[-1]) / len(x) + 1 / len(x)
return gini_coef
#출처: https://vincenthanna.tistory.com/9

def gini(list_of_values):
    sorted_list = sorted(list_of_values)
    height, area = 0, 0
    for value in sorted_list:
        height += value
        area += height - value / 2.
    fair_area = height * len(list_of_values) / 2.
    return (fair_area - area) / fair_area

gini(dencov_accss)
결과물 예시

(코드 출처: ChatGPT)
728x90
반응형
'Data Analysis > Python' 카테고리의 다른 글
| [Python] 파이썬으로 한글 Word cloud 만들기 (0) | 2024.02.06 |
|---|---|
| [Python] 한글 자연어 처리하기, Kkma, konlpy, 문장 분석, 단어 분석, 형태소 분석 (1) | 2024.02.06 |
| [API] 제주데이터허브 API key로 데이터 받는 법 (0) | 2023.10.25 |
| [Python] geocoding하는 법, 주소로 좌표 찾기 (0) | 2023.10.01 |
| [Python] geopy를 활용하여 주소를 좌표로 바꾸기 (0) | 2023.01.16 |


