
키워드 네트워크
1. Node와 Edge
- Network: Node와 Edge로 이루어진 자료 구조
- Node: vertex라고도 부르며, network를 이루는 각 점을 의미한다 ex) twitter user network를 만든다면, user들이 각각의 node
- Edge: link, 또는 tie라고도 부르며, 각 node 간의 관계를 의미한다 ex) twitter user network를 만든다면, user(=node)간 follow 관계를 edge로 표현할 수 있다
2. Centrality: node의 중요성을 판별할 때 활용
- Degree Centrality, Betweenness Centrality, Closeness Centrality, Eigenvector centrality
아래 글을 참고해서 작성했습니다.
https://chaelist.github.io/docs/network_analysis/network_basics/#centrality
Network Analysis 기초
chaelist’s blog
chaelist.github.io
파이썬 코드
1. 패키지 불러오기
# 패키지 설치
!pip install nltk
!pip install --upgrade pip
!pip install konlpy
!pip install wordcloud
!pip install --upgrade gensim
!pip install matplotlib
import pandas as pd
import re
from itertools import combinations
from konlpy.tag import Kkma
import networkx as nx
from tqdm import tqdm
import matplotlib.pyplot as plt데이터 전처리, 단어 분석, 네트워크 분석에 필요한 패키지들을 임포트한다.
2. 데이터 전처리
# 작업 경로 지정
file_path = 'D:/*/'
# read excel data
data = pd.read_excel(file_path + 'data.xlsx', sheet_name=0) # 첫번째 시트 불러오기
# NaN 값을 빈 문자열로 대체
df['words'] = df['words'].fillna('')
# 한글만 추출하는 함수 정의
def extract_korean(text):
korean_only = re.sub(r'[^ㄱ-ㅎㅏ-ㅣ가-힣\s]', '', text)
return korean_only
# "words" 열에서 한글만 추출하여 업데이트
df['words'] = df['words'].apply(extract_korean)
# dataframe을 csv로 저장
df.to_csv(file_path + 'kn data.csv', index=False)작업 경로를 지정하고, 각 행마다 텍스트가 정리된 데이터를 불러온다. pd.read_excel로 엑셀 파일을 불러올 때 sheet_name 파라미터를 활용하여 시트 번호를 지정할 수 있다.
df['words'] 행에 NaN 값이 있어서 빈 문자열로 대체했다.
이후, 한글만 추출하는 함수를 통해 숫자와 영어는 모두 제외했고, 이를 csv 파일로 내보내기 했다.
3. 꼬꼬마로 명사 분석
kkma = Kkma()
all_keywords = []
# 불용어 리스트 정의
stopwords = ['을', '위한', '을', '그', '분석', 'ㄴ', '이', '어', '하']
for i in range(len(df['words'])):
title = df['words'][i]
morphemes = kkma.nouns(title)
morphemes = [word for word in morphemes if word not in stopwords]
all_keywords.append(morphemes)
print(i)빈 리스트를 생성하고 stopwords를 지정했다.
for 구문을 통해 명사를 분석하고, stopwords에 있는 단어들은 제외하여 all_keywords 리스트 안에 추가했다. 이때, print(i)를 통해 오류가 발생하는 지점을 찾고자 했다.
이때 데이터 내에 '\n'가 있으면 java.lang.NullPointerException: java.lang.NullPointerException 오류가 발생한다. 이 경우에는 df['words'] = df['words'].str.replace('\n','').str.replace('\t','').str.replace('\r','')와 같이 \n, \t, \r를 모두 공백으로 대치하면 된다.
4. 키워드 네트워크 그래프 생성
# 그래프 생성
G = nx.Graph()
# tqdm 적용하여 반복문 진행 상황 확인
for i, title in tqdm(enumerate(df['words']), total=len(df['words'])):
morphemes = kkma.nouns(title) # 명사 분석
morphemes = [word for word in morphemes if word not in stopwords] # 스탑워드에 있는 단어 제외
# 단어들을 그래프에 추가
for word in morphemes:
if not G.has_node(word):
G.add_node(word)
# 단어 빈도 추가
for word in morphemes:
if word in word_freq:
word_freq[word] += 1
else:
word_freq[word] = 1
# 단어들의 조합을 이용하여 동시 출현 빈도를 계산하고 엣지를 추가
word_combinations = combinations(morphemes, 2)
for w1, w2 in word_combinations:
if G.has_edge(w1, w2):
G[w1][w2]['weight'] += 1
elif w1 != w2: # 자기 자신과의 조합은 제외
G.add_edge(w1, w2, weight=1)
# 단어 빈도수를 노드 속성으로 추가
nx.set_node_attributes(G, word_freq, name='word_freq')그래프를 생성한 뒤, 명사 단어들을 노드에 추가하고 빈도를 계산하여 추가했다. 또, 단어들의 동시 출현 빈도를 계산하여 엣지 정보에 입력했다.
# 중심도 계산
centrality = nx.degree_centrality(G)
centrality2 = nx.eigenvector_centrality(G)
sorted_centrality2 = sorted(centrality2.items(), key=lambda x: x[1], reverse=True)
df_centrality2 = pd.DataFrame(sorted_centrality2, columns=['Node', 'Eigenvector_Centrality'])
df_centrality2.to_csv(file_path + 'centrality2.csv', index=False, encoding='cp949')
# 노드의 중심도 값을 노드의 속성으로 추가
nx.set_node_attributes(G, centrality, name='degree_centrality')
nx.set_node_attributes(G, centrality2, name='igen_centrality')
# 그래프를 graphml 파일로 저장
nx.write_graphml(G, file_path + 'keyword_network.graphml')노드에 디그리 중심성과 아이겐벡터 중심성 두 가지 정보를 추가했고, 중심성과 관련된 이론은 아래 글을 참고했다.
마지막으로 graphml 파일을 생성했다.
Network Analysis 기초
chaelist’s blog
chaelist.github.io
5. 그래프 시각화
# 중심도를 기준으로 상위 30개의 키워드 선택
top_centrality = dict(sorted(centrality.items(), key=lambda x: x[1], reverse=True)[:30])
top_keywords = list(top_centrality.keys())
# 상위 30개 키워드에 대한 그래프 생성
subgraph = G.subgraph(top_keywords)
# 그래프 시각화
plt.figure(figsize=(12, 8))
pos = nx.spring_layout(subgraph, k=0.15) # 그래프 레이아웃 설정
# 중심도에 따라 노드 크기 설정
node_size = [v * 2000 for v in top_centrality.values()]
# 노드와 엣지 그리기
nx.draw_networkx_nodes(subgraph, pos, node_size=node_size, node_color='skyblue', alpha=0.5)
nx.draw_networkx_edges(subgraph, pos, edge_color='gray', alpha=0.7)
# 노드 라벨 추가
nx.draw_networkx_labels(subgraph, pos, font_size=10, font_family='NanumGothic')
plt.axis('off') # 축 제거
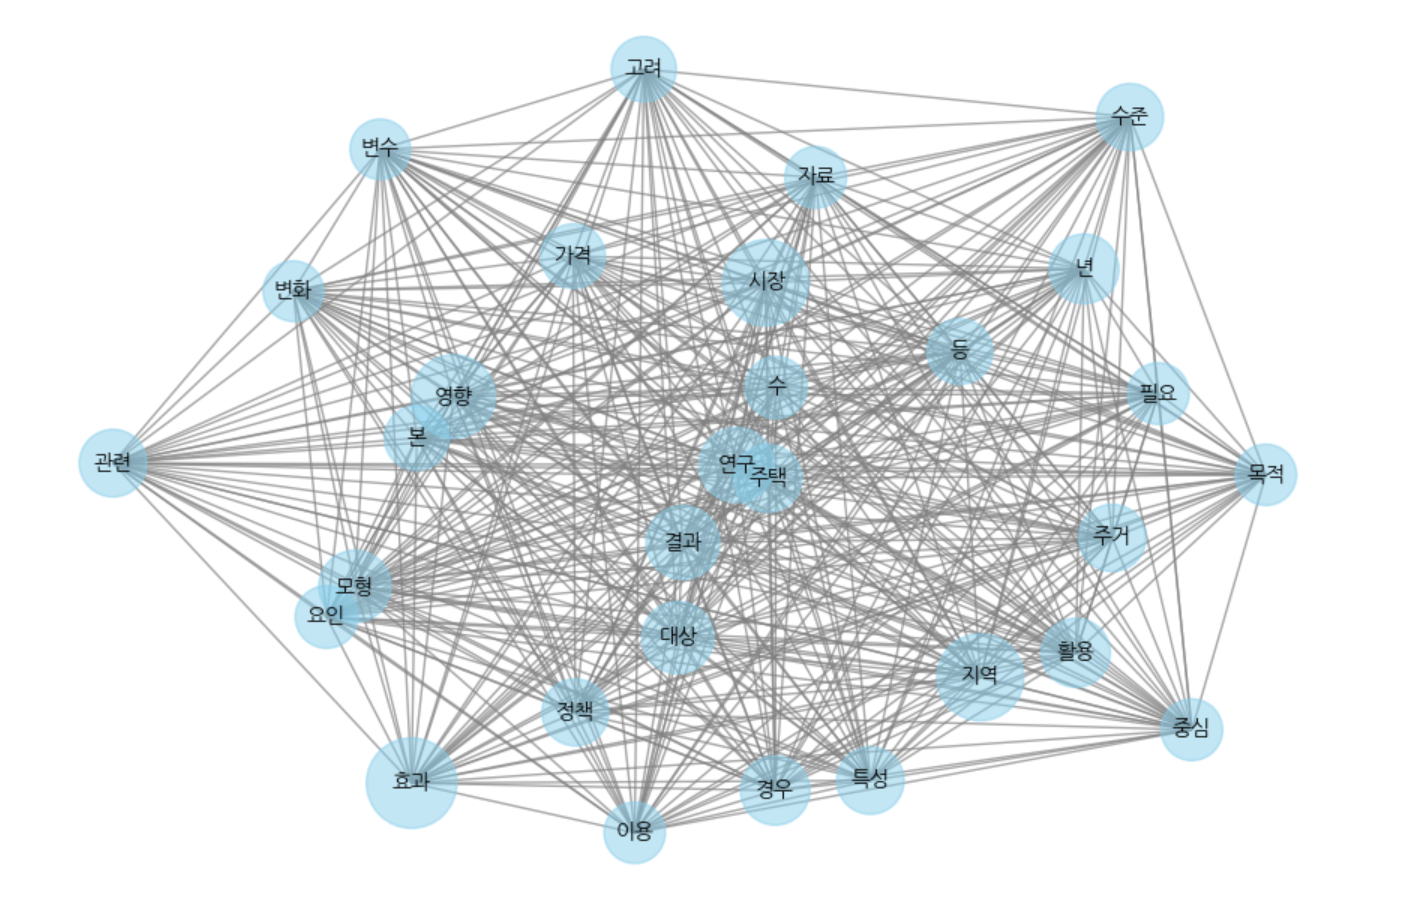
plt.show()중심성 값 상위 30개 단어들만 추출하여 networkx 모듈로 그래프를 작성해 봤다.
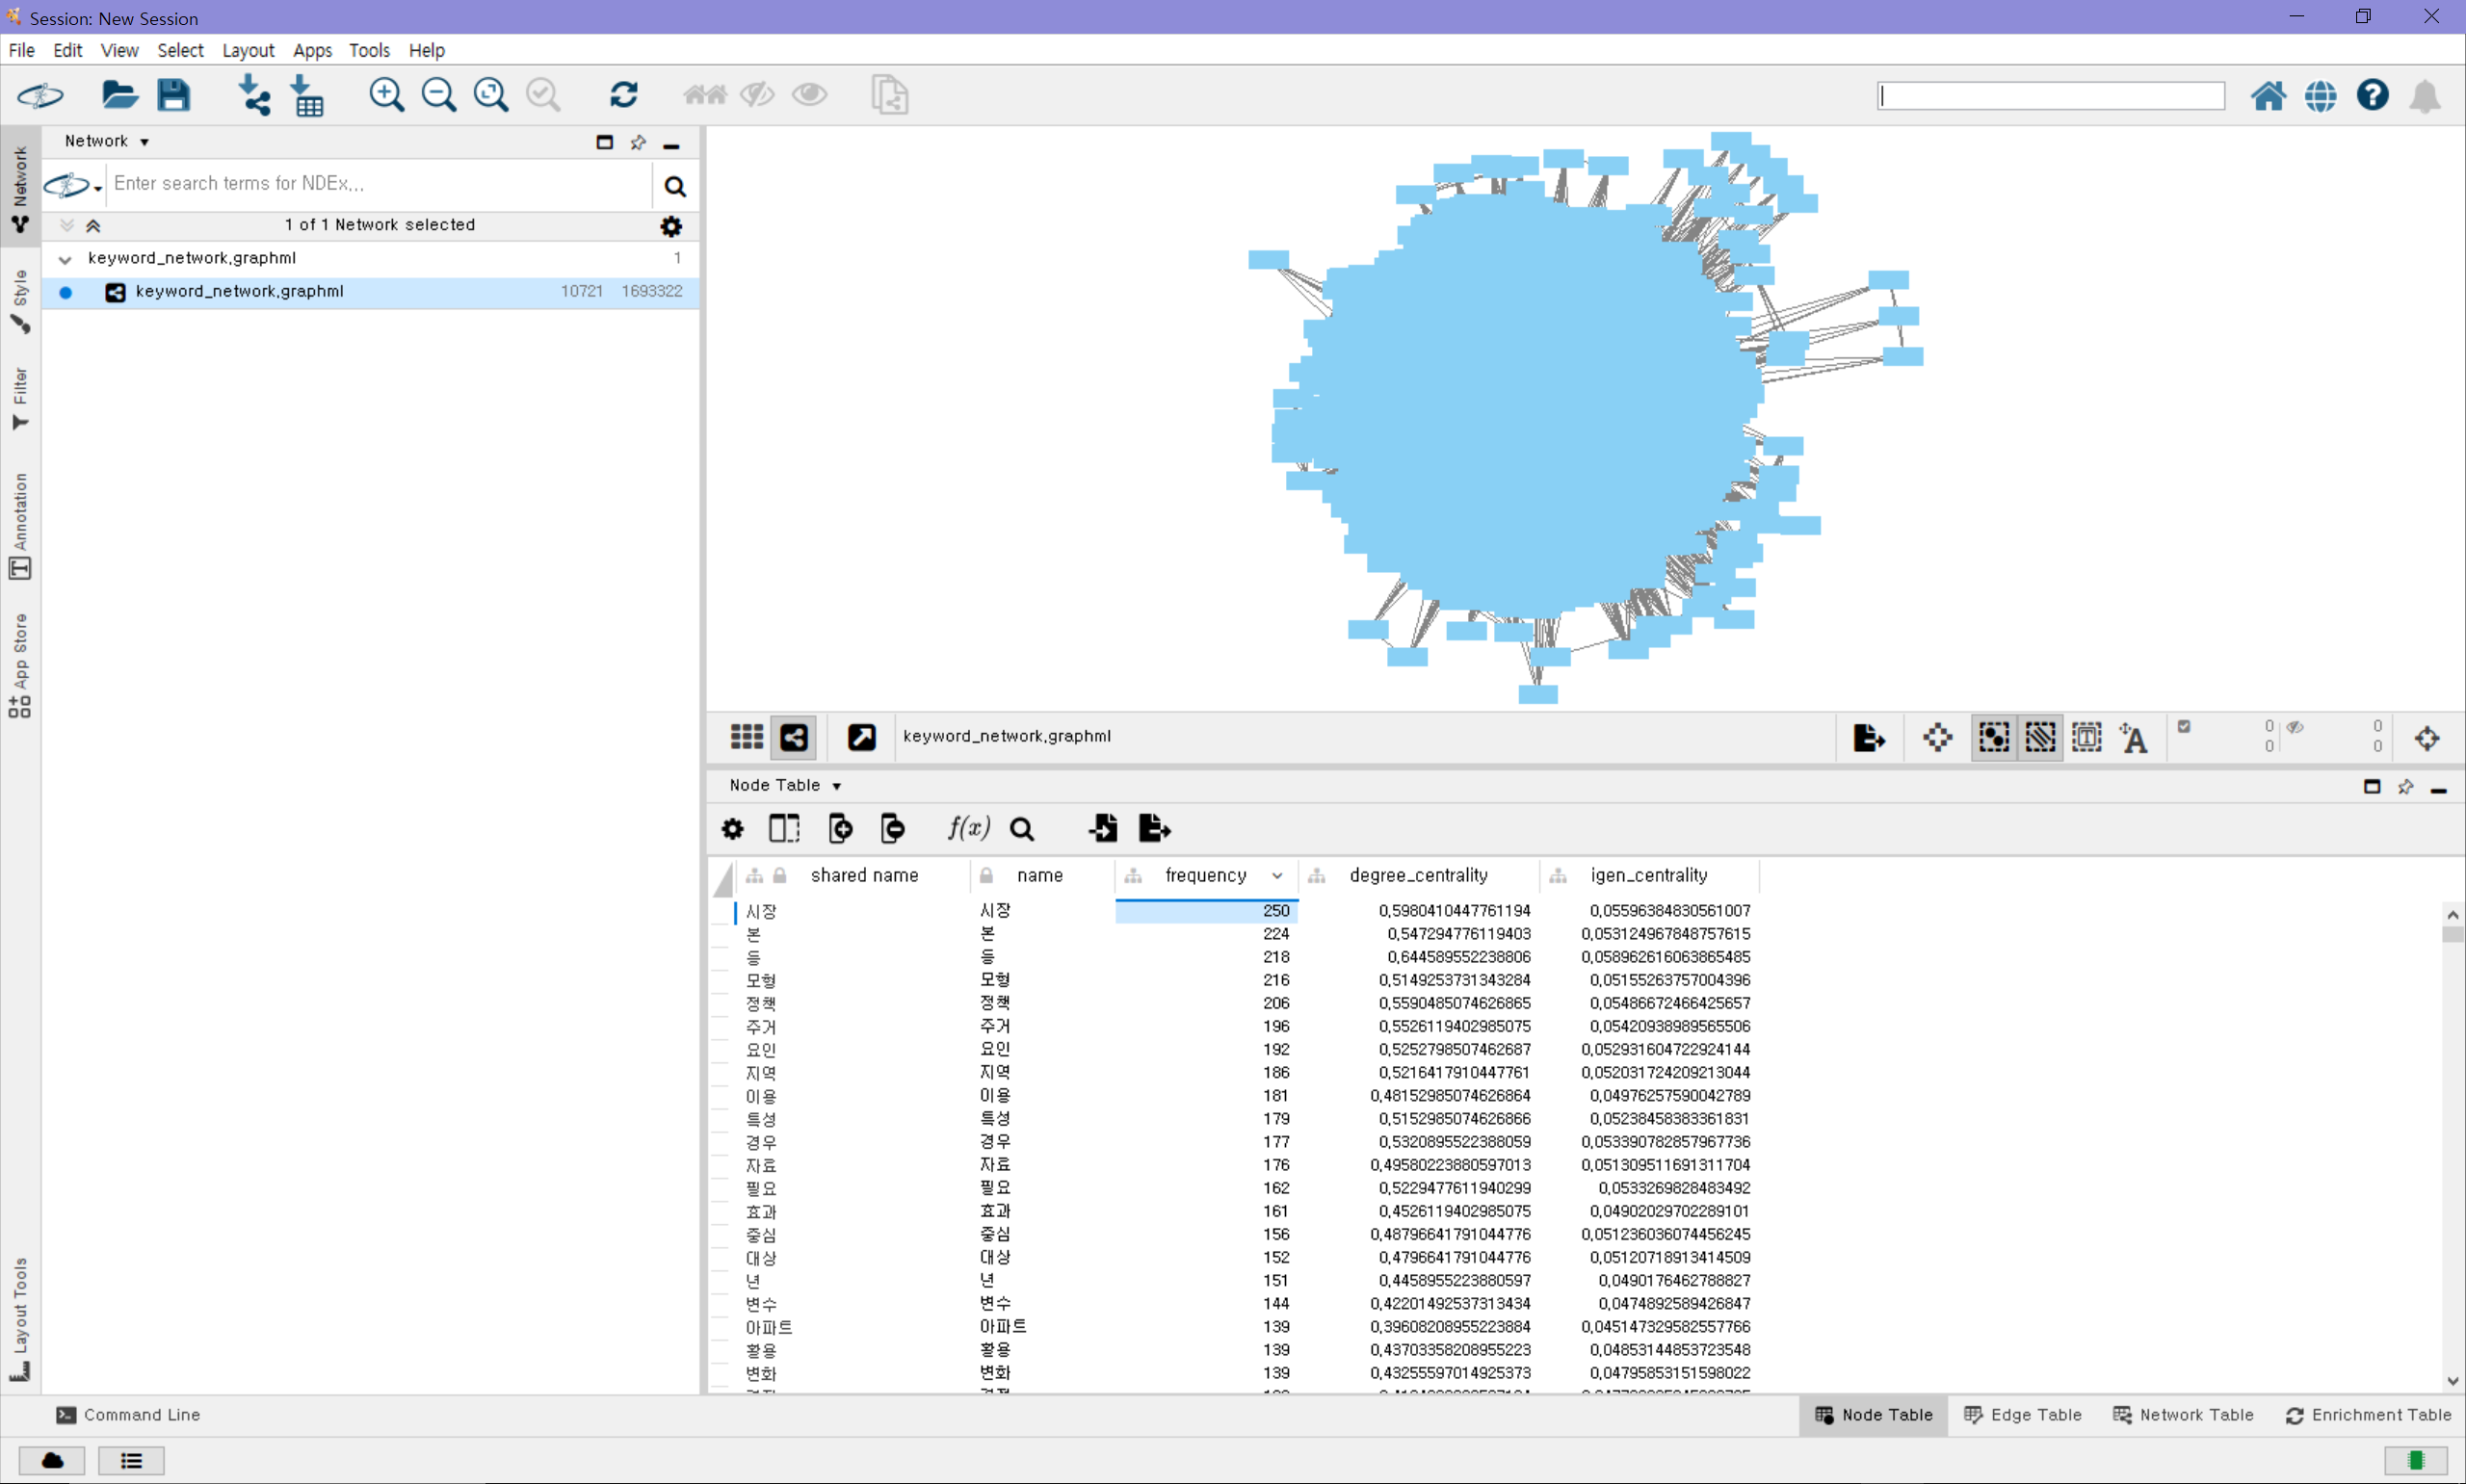
생성한 graphml 파일은 cytoscape에서도 예쁘게 시각화할 수 있다. cytoscape 활용법은 아래 글 참고.
https://luckylucy.tistory.com/24
[Cytoscape] 1. Cytoscape 설치 및 간단한 사용법
Cytoscape는 graphml 형식의 파일을 import 하여 네트워크를 만들 수 있는 GUI 환경의 오픈 소프트웨어이다. Cytoscape 공식 웹사이트에는 '복잡한 네트워크를 시각화하고 이를 모든 유형의 속성 데이터와
luckylucy.tistory.com
https://luckylucy.tistory.com/25
[Cytoscape] 2. Cytoscape 그래프 스타일링
이 글은 이전 글에 이어서 기본적인 그래프를 생성한 뒤, 원하는 대로 스타일링 하는 법에 대해 다룬다. 레이아웃 선택하기 위의 Layout 메뉴에서 다양한 layout을 선택할 수 있으며, 자동으로 node들
luckylucy.tistory.com
6. 중심성 값을 csv로 저장
sorted_centrality2 = sorted(centrality2.items(), key=lambda x: x[1], reverse=True)
df_centrality2 = pd.DataFrame(sorted_centrality2, columns=['Node', 'Eigenvector_Centrality'])
df_centrality2.to_csv(file_path + 'centrality2.csv', index=False, encoding='cp949')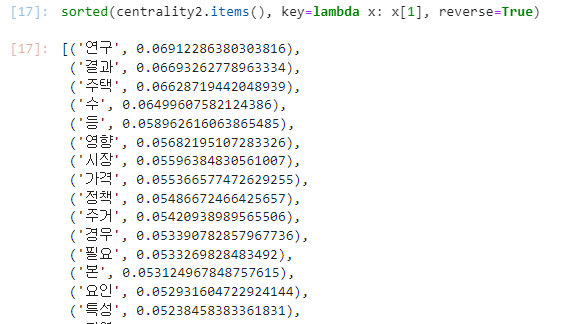
'Data Analysis > Python' 카테고리의 다른 글
| [Python] geopandas 설치 오류 해결 (0) | 2024.06.23 |
|---|---|
| [Python] 토픽 모델링 (Topic Modeling) (2) | 2024.02.21 |
| [Python] 키워드 분석 꼬꼬마 모듈 사용 중 java.lang.NullPointerException: java.lang.NullPointerException 오류 해결 (0) | 2024.02.19 |
| [Python] Window 10에 konlpy 설치하는 방법 (0) | 2024.02.07 |
| [Python] 파이썬으로 한글 Word cloud 만들기 (0) | 2024.02.06 |


